Last year, some groups of students in their community (社区) made a survey about “How do people spend their free time? ” The following diagrams(图表) show some results of it:
Diagram (1): Hours for people of different ages who surf the Internet in a week.
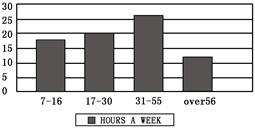
Diagram (2): Different days people go to the library. (library attendance出席)
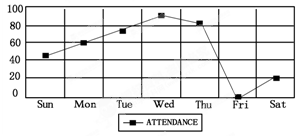
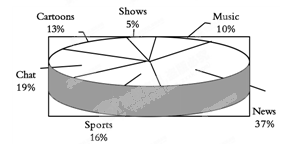
Diagram (3): Different programs people like.
小题1:People aged spend the most time surfing the Internet every week.
A.7—16
B.17—30
C.31—55
D.over 56小题2:How many people go to the library on Saturdays?
A.About 20%.
B.About 40%.
C.Over 60%.
D.More than 80%.小题3:The three diagrams show us the results of a survey about .
A.what people do every day
B.people’s different habits
C.people’s different lifestyles
D.how people spend their free time
小题1:C
小题2:A
小题3:B
题目分析:本文以表格的形式,用数字显示了不同年龄的段的人在不同的时间他们的生活习惯。
小题1:细节理解题。根据表格1可知31-55年龄段的人上网的时间最长,故选C。
小题2:细节理解题。根据表2可知大约有20%的人去图书馆,故选A。
小题3:细节理解题。三个表格显示了人们的不同的生活习惯,故选B。