Directions:
Study the following bar charts carefully and write an essay to
1) point out the implication of the bar charts,
2) analyze the phenomenon, and
3) give some suggestions
You should write 160-200 words on ANSWER SHEET Ⅱ.
参考答案:
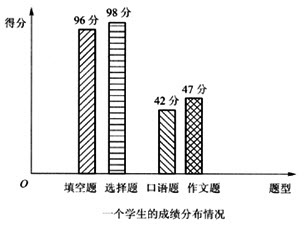
The bar charts account for the academic performance of a student in an English proficiency test. As is shown in the chart, the student tends to do better in the section related to language basics. However, in the section concerning oral and writing ability, the student presents poor performance.
The result above also applies to many other students. It is not unusual that some students do well in any examination concerning blank filling and multiple choices, for the test skills or what we call "knacks" make it easier to find out the best answer. Sometimes a student, with the aid of test skills, can figure out the answer without knowing what the sentence means. However, it is quite different if one writes or speaks. These abilities emphasize information accumulation and active thinking. If students seldom read comprehensively or think creatively, they can hardly collect enough information or knowledge for output. Additionally, if they don’t think creatively, they will never know that logical thinking and dialectical methods are useful for fluent speaking and writing. By contrast, it is relatively easy for a student to learn how to fill out a blank or pick out a correct answer. In a sense, the scene depicted in the charts above tends to illustrate such an observation.
It is urgent that some measures be taken to improve the youngsters’ oral and writing ability. For one thing, the school teachers are expected to improve their teaching skills, encouraging students to think and discuss rather than to seek correct answers only. For another thing, students have to pay due attention to speaking and writing. Still, it requires practice if one wants to learn to speak and write effectively. Only in this way can the fruit of English learning be better demonstrated seen in the tests.