Directions:
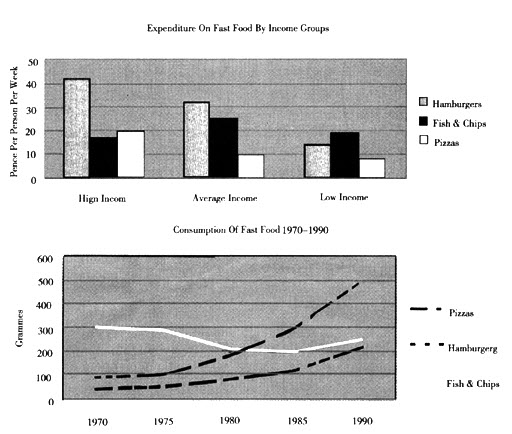
The chart indicates the amount of money per week spent on different types of fast food in Britain. The graph shows the trends in consumption of fast food.
Write a report for your university lecturer describing the information shown in both charts.
You should write about 160-200 words neatly on ANSWER SHEET 2.
参考答案:
The bar chart shows the consumption situation of different types of fast food—hamburgers, fish and chips, and pizzas per week per person. People with higher in comes prefer hamburgers (over D0 pence per week per person). They eat similar amounts of fish and chips and pizzas, although slightly more of the former. People with middle-level incomes spend more on hamburgers (over C0 pence per week per person), while spending the least on pizzas (A0 pence per week per person). People with low incomes favor fish and chips (over AG pence per week per person), while they spent the least on pizzas (G pence per week per person). We may draw the conclusion that a mong people of different income levels, hamburgers are the favorite type of fast food, while pizzas are the least preferred.
The graph describes the consumption trends of these kinds of fast food in the period AIG0 to AII0. Sales of hamburgers increased rapidly, overtaking sales of the other two items after AIHB. The consumption of fish and chips fluctuated around BE0g per year, and the sales of pizzas never topped BE0g.
The information in the graph corroborates the information in the chart: hamburgers are becoming more popular among people of all income levels, while the demand for pizzas is static.