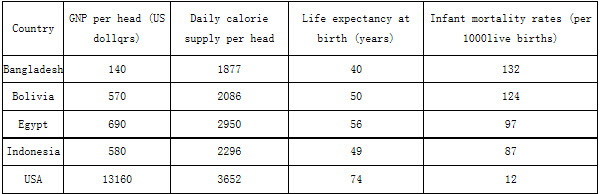
The following table gives statistics showing the aspects of quality of life in five countries. Write a report for a university lecturer describing the information in the table below.
参考答案:
The table uses four broad economic indicators to show the standard of living in five selected countries, including both the most developed nation in the world and some of the less developed nations. There is no denying the fact that the USA had much higher quality of life than other countries.
As can be clearly seen from the statistics, the USA-one of the richest countries in the world-had the highest GNP and daily calorie intake, the longest life expectancy and the lowest infant mortality rate. The other developing countries had a considerably lower quality of life. Egypt, Indonesia, and Bolivia are similar in their range of indicators. However, Egypt’s infant mortality rate was slightly higher than Indonesia’s, at IG deaths per A000 compared to HG in Indonesia. Bangladesh had the lowest quality of life in all the four indicators. Its GNP was about one-hundredth that of the USA. The figures in terms of the daily calorie supply per head and life expectancy at birth in Bangladesh are the half of those respectively in USA, and its infant mortality rate was about A0 times greater.
In conclusion, it goes without saying that the four developing countries have to develop a lot more before reaching the same level of quality of life as the USA. At the same time, the USA has the responsibility to help the other countries to develop their economies and improve their people’s living standards.