问题 单项选择题

读等高线地形图(下图),完成下题。

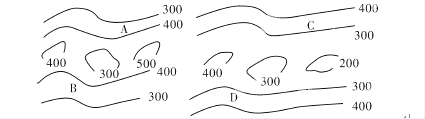
如果该图位于印度东北部地区,降水最多的地形部位可能为()

A.A处

B.B处

C.C处

D.D处

答案

参考答案:B

解析:

印度东北部地区属于季风气候,雨季受西南季风影响。读图,根据海拔高度分析,图中四地A位于西南季风的背风坡,降水少,选项A错。B位于西南季风迎风坡,降水多,选项B对。C处位于山谷内,已经有D处山坡阻挡水汽,降水少,D处也是背风坡,降水少,选项C、D错。

考点:等高线图的应用,地形对降水的影响。

单项选择题
单项选择题 案例分析题

The economy of the United states after 1952 was the econnomy of a well-fed,almost fully employed people. Despit occasional alarms, the country escaped any postwar depression and lived in a state of boom. A n economic survey of the year 1955, a typical year of the 1950’s, may be typical as illustrating the rapid economic growth of the decade. The national output was value at 10 percent above that of 1954 (1955 output was estimated at 392 billion dollars). The production of manufacturers was about 40 percent more than it had averaged in the years immediately following World War 2. The country’s business spent about 30billion dollars for new factories and machinery. National income available for spending was almost a third greater than it had been it had been in 1950. Consumers spent about 256 billion dollars; that is about 700 million dollars a day ,or about twenty-five million dollars every hour , all round the clock. Sixty-five million people held jobs and only a little more than two million wanted jobs but could not find them . Only agriculture complained that it was not sharing in the room. To some observers this was an ominous echo of the mid-1920’s . As farmer’s shre of their products declined , marketing costs rose. But there were , among the observers of the national economy, a few who were not as confident as the majority . Those few seemed to fear that the boom could not last and would eventually lead to the oppsite-depression.

Which of the following were LEAST satisfied with the national economy in the 1950’s?()

A.Economists

B.Frmaers

C.Politicians

D.Steelworkers