Directions:
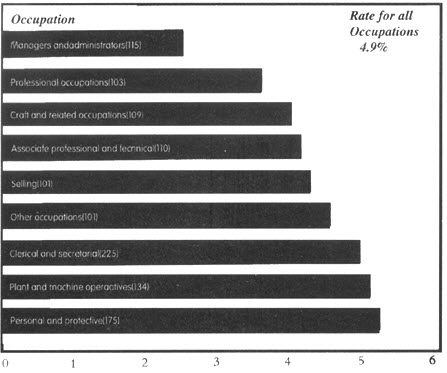
The figure shows the percentage of employees in each occupation absent from work for at least one day in a reference week in 1999 due to injury or illness.
Write a report for a university lecture describing the information shown below.
You should write about 160—200 words neatly on ANSWER SHEET2.
Percentage of employees absent
(Figures in brackets equal number of employees couted)

参考答案:
The bar chart illustrates the percentage of employees in different occupations absent from work in a given week in AIII.
It is noticeable that the best paying jobs have the lowest rate of absenteeism with managers and administrators recording only around C.BE% absent. This is nearly A% less than the next lowest rate of absenteeism, which were professional occupations at just over D%.
On the other hand the highest rate of absenteeism was found in personal and protective occupations, plant and machine operatives and clerical and secretarial jobs. All of these had absent rates of just below F%, noticeably higher than the rate for all occupations of D.I%. However, it is also important to notice that the figures show that these sectors employ the highest number of people.
In conclusion, it would seem that managers and administrators are the least likely to be absent from work while plant and machine operators and personal and protective staff are the most likely to call in sick.
