问题
阅读理解
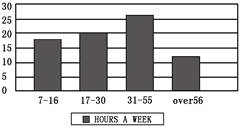
Last year, some groups of students in their community made a survey (调查) about “How do people spend their free time? ” The following diagrams(图表) show some results(结果) of it: Diagram (1): Hours for people of different ages who search the Internet in a week.
Diagram (2): Different days people go to the library. (library attendance出席) 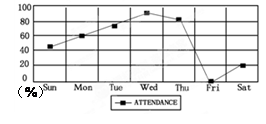 Diagram (3): Different programs (节目) people like. 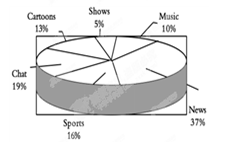 小题1:People aged spend the most time searching the Internet every week.
小题2:How many people go to the library on Monday?
小题3:Which program do people like best?
小题4:The three diagrams show us the results of a survey about .
|
答案
小题1:C
小题2:B
小题3:C
小题4:D
题目分析:这篇文章主要告诉我们人们如何度过空余时间的调查结果,提供了三个图表。图表一是不同年龄段人每周的上网时间;图表二是人们一周内每天去图书馆的情况;图表三是人们喜欢的节目。
小题1:细节理解题。从图表一中可知年龄在31至55岁的人每周上网的时间最多。故选C。
小题2:细节理解题。从图表二中可知大约60%的人周一去图书馆。故选B。
小题3: 细节理解题。从图表三中可知人们最喜欢的是新闻频道。故选C。
小题4:主旨大意题。这篇文章主要告诉我们人们如何度过空余时间的调查结果。故选D。